Charts
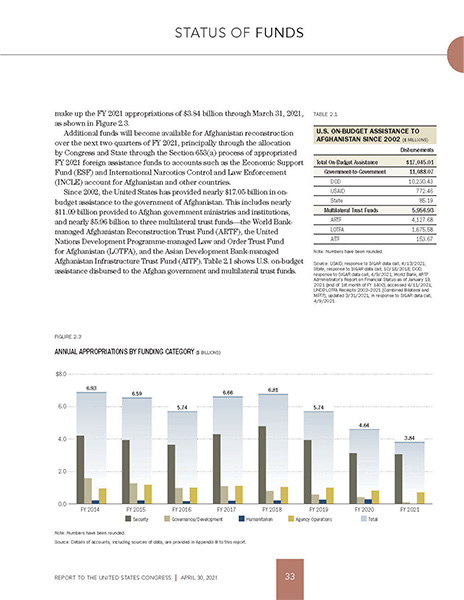
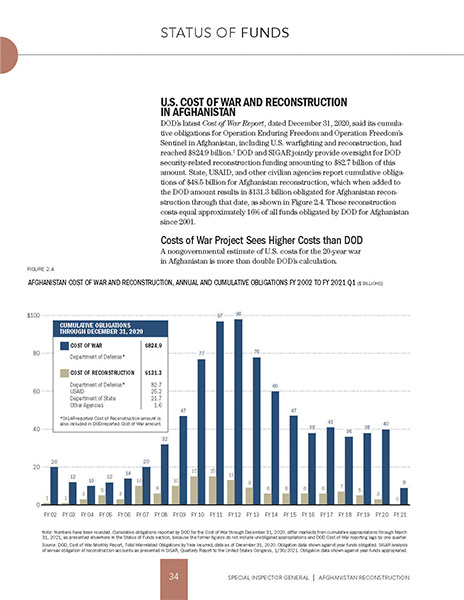
Quarterly Report Funds Examples, SIGAR
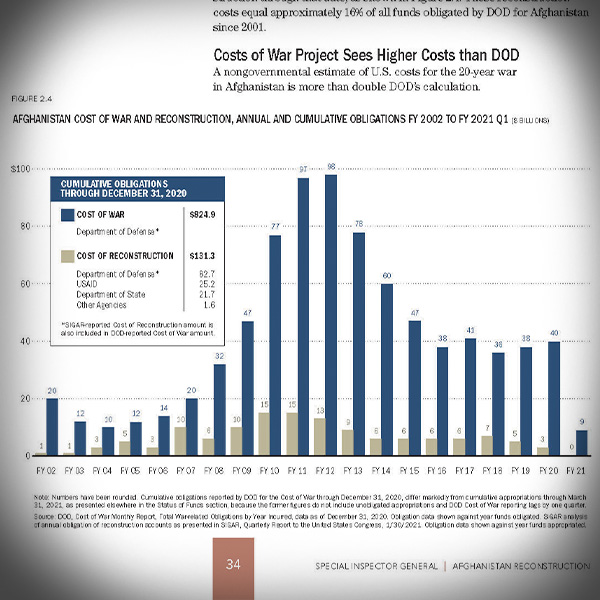
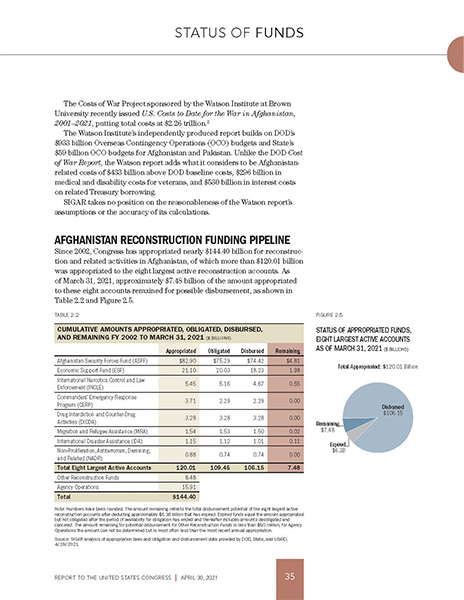
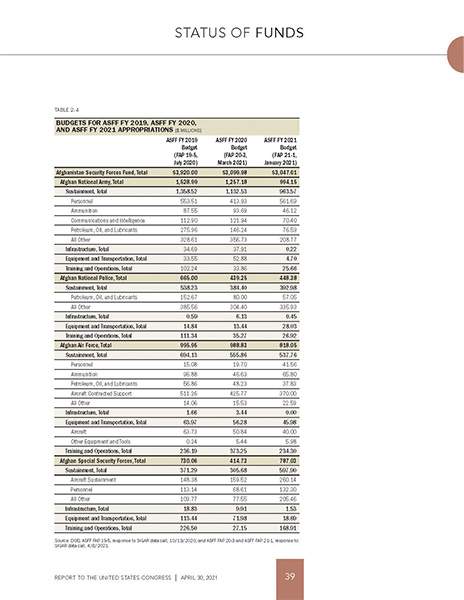
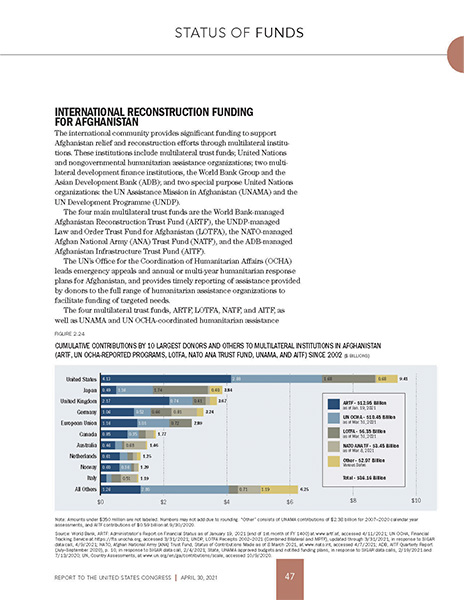
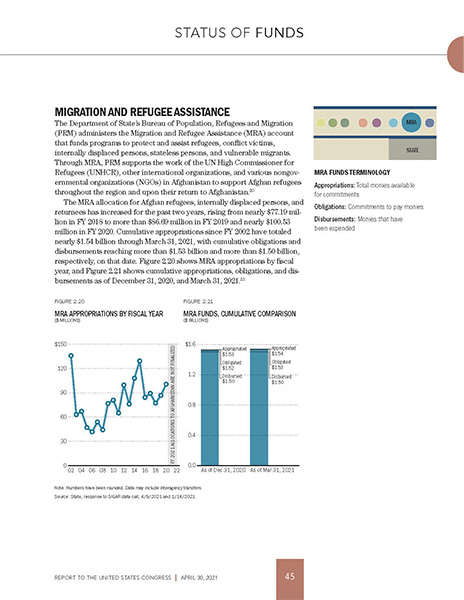
These charts, pulled from the April 2021 SIGAR Quarterly Report, provide a sampling of bar charts, pie charts, and tables that illustrate the status of funding for that quarter.
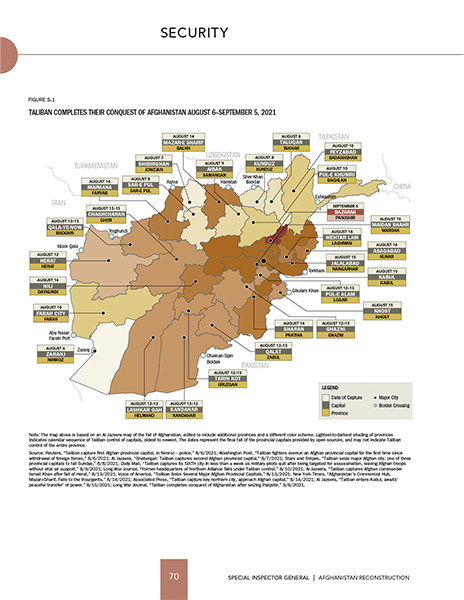
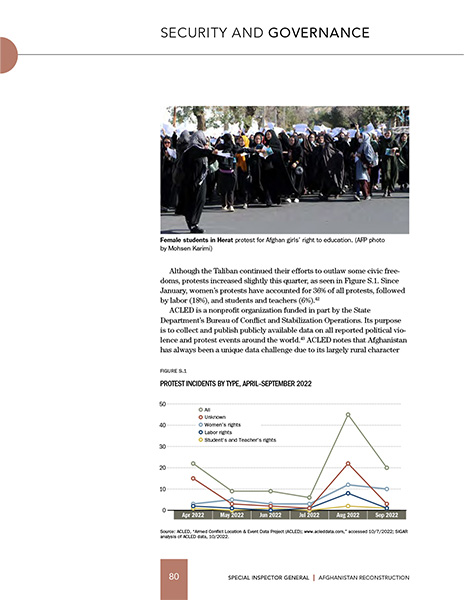
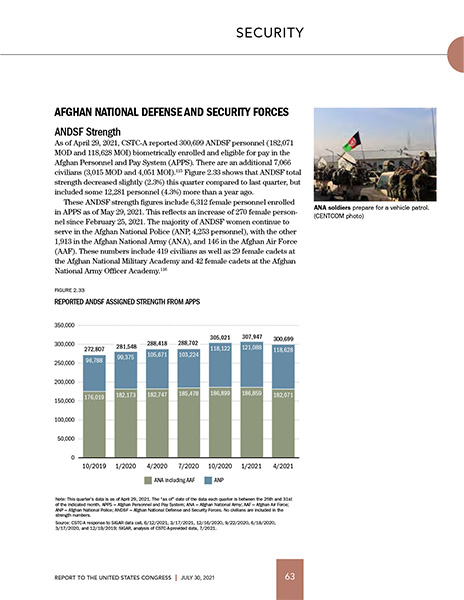
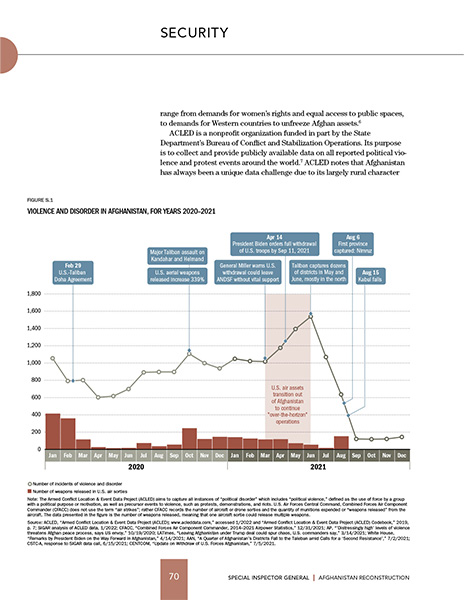
Quarterly Report Examples, SIGAR
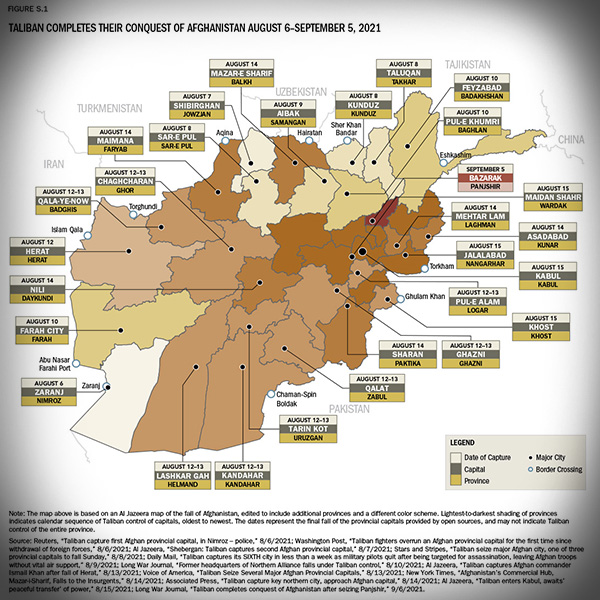
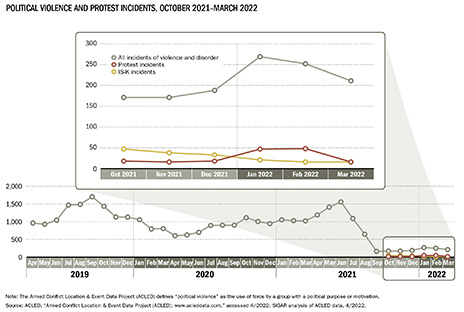
These charts, pulled from various SIGAR Quarterly Reports, provide a sampling of bar charts, line charts, and a map that illustrate the security aspects for that quarter.
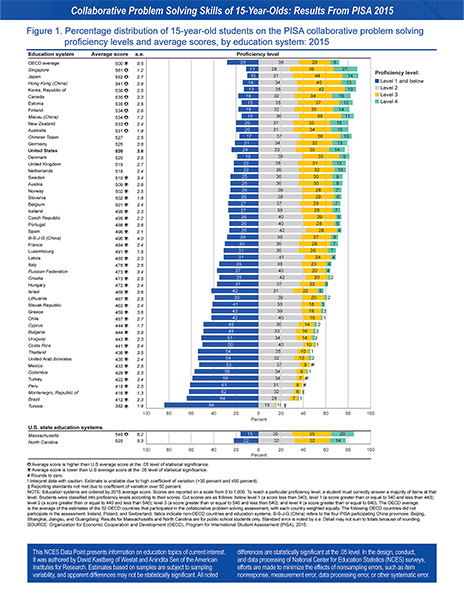
Figures from PISA 2015
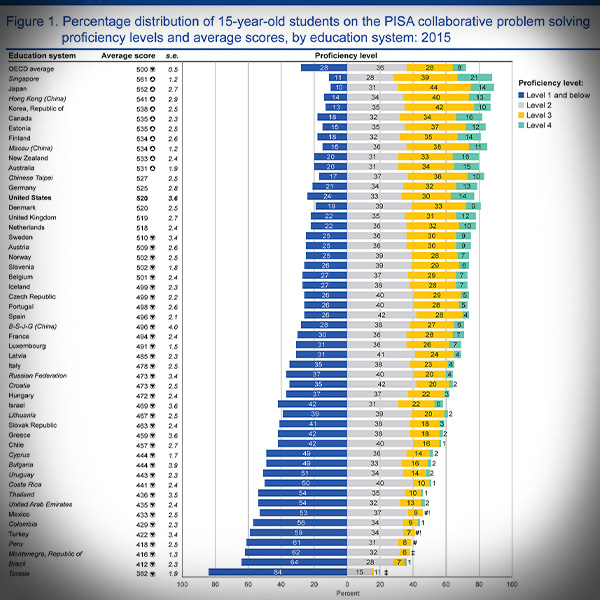
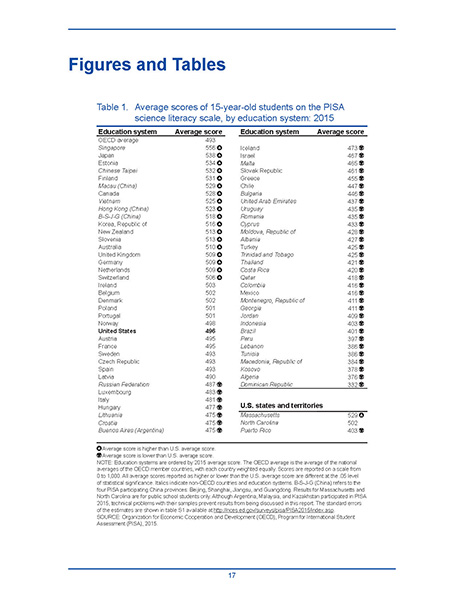
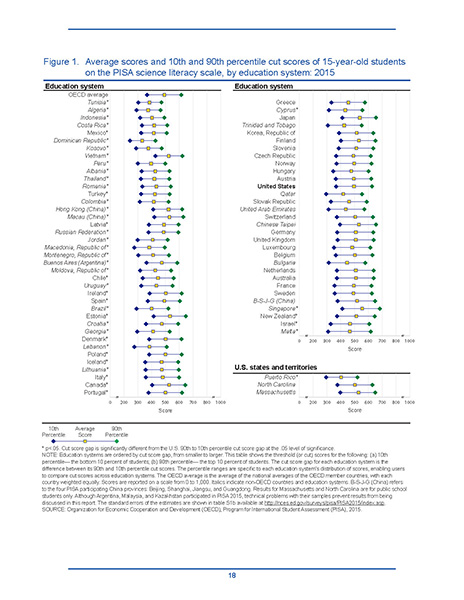
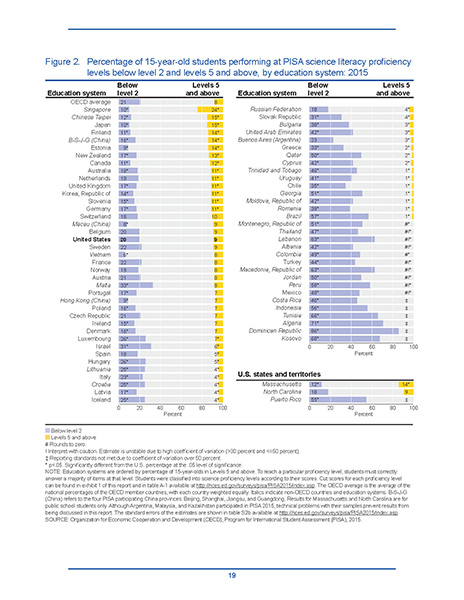
These charts, pulled from the PISA 2015 report, provide a sampling of bar charts and tables, and a combination of the two, all 508-compliant, that illustrate a comparison of scores of 15-year-old students in over 70 countries.
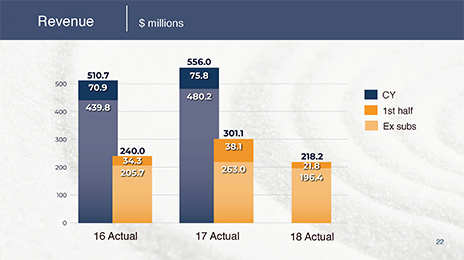
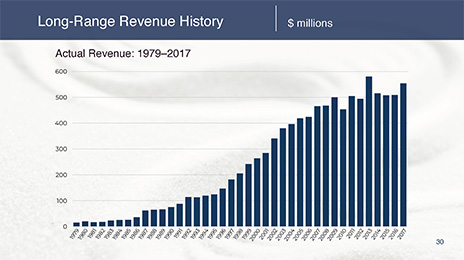
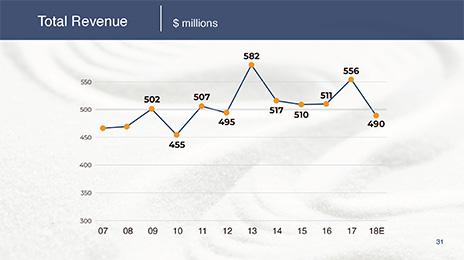
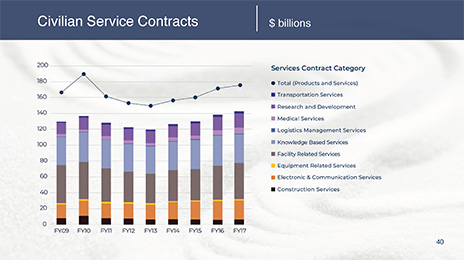
Annual Company Revenue Presentation
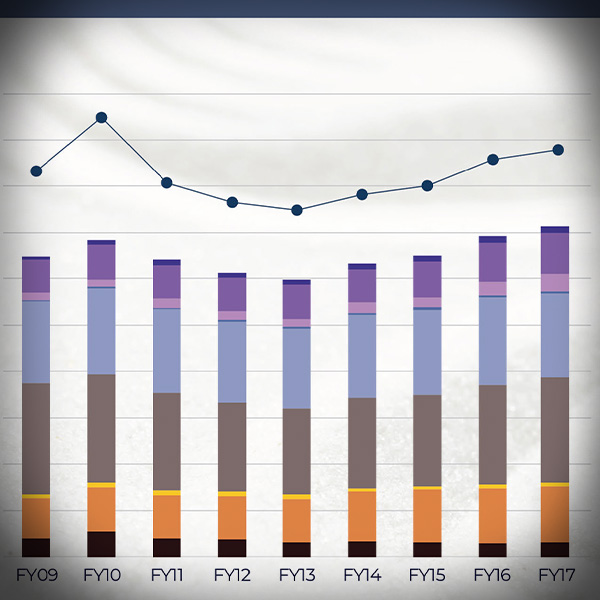
These charts pulled into PowerPoint for an annual staff meeting, provide a sampling of bar charts and line charts that illustrate year-over-year data fluctuations.
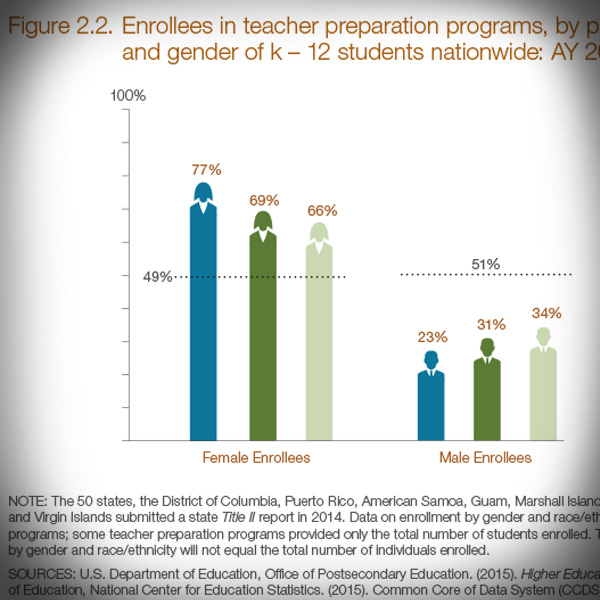
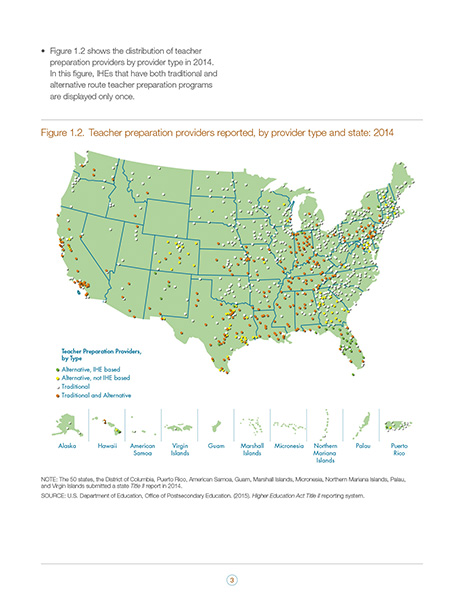
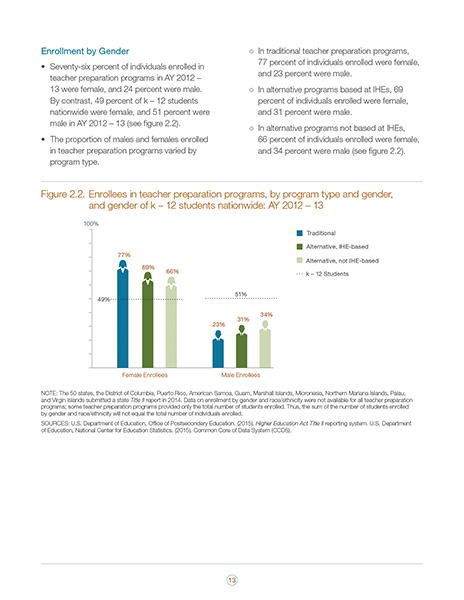
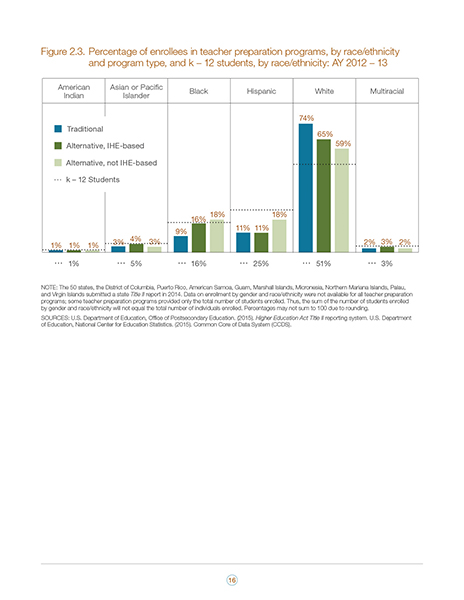
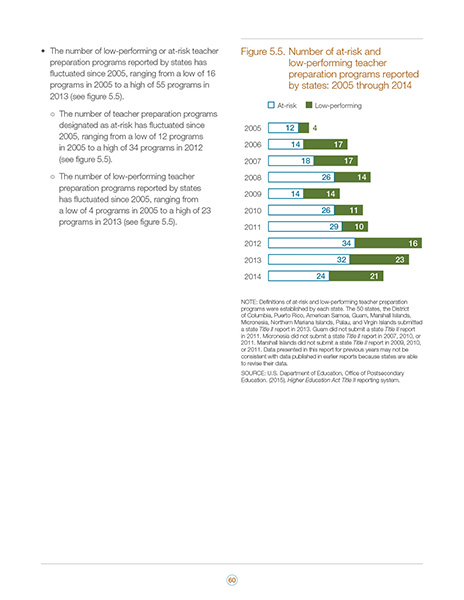
Title II, U.S Department of Education
These charts, pulled from “The Secretary's 10th Report on Teacher Quality” (U.S. Department of Education), provides a sampling of over 30 figures used in the report.
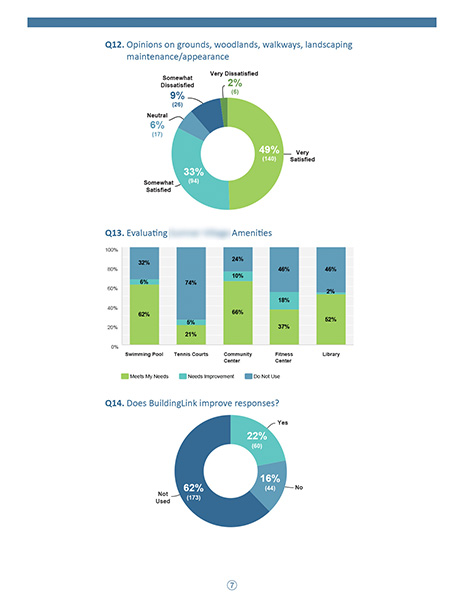
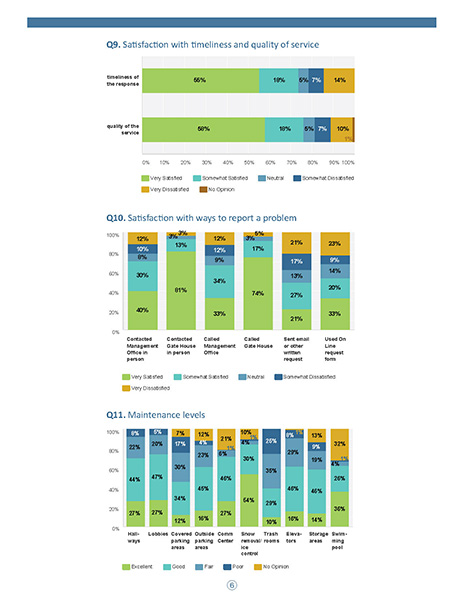
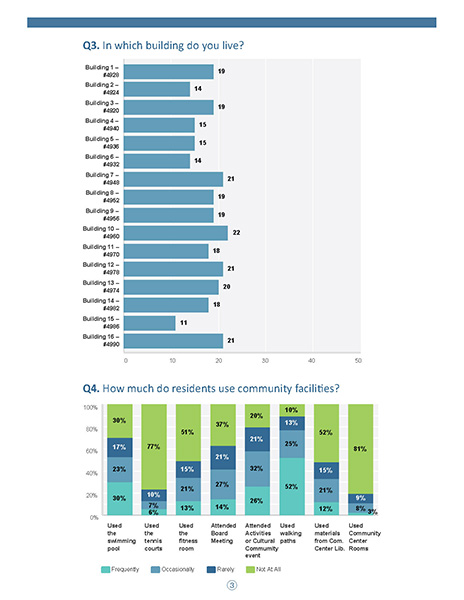
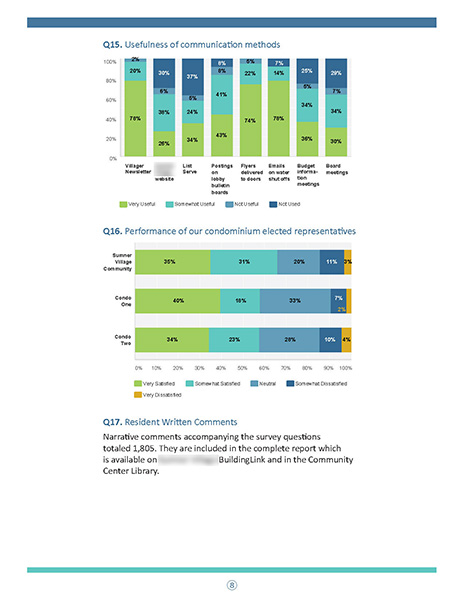
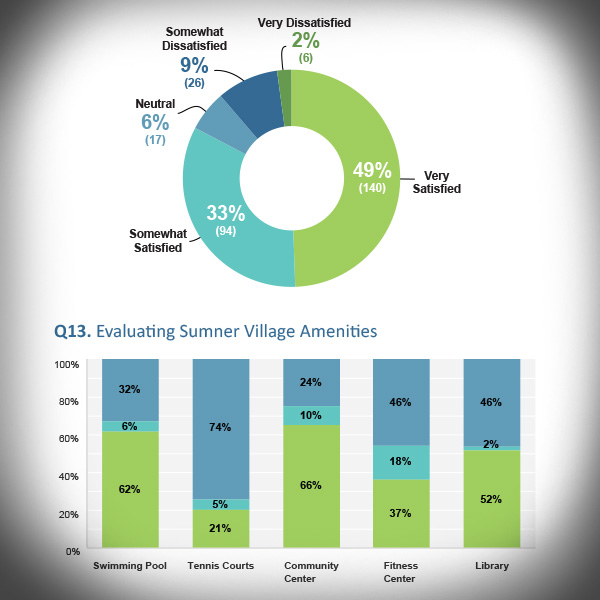
Resident Community Survey Results
These charts, pulled from a resident survey, provide a sampling of figures that illustrate the concerns of a community.